rivus: A mixed integer linear optimisation model for energy infrastructure networks
| Maintainer: | Johannes Dorfner, <johannes.dorfner@tum.de> |
|---|---|
| Organization: | Chair of Renewable and Sustainable Energy Systems, Technical University of Munich |
| Version: | 0.1 |
| Date: | Oct 11, 2017 |
| Copyright: | This documentation is licensed under a Creative Commons Attribution 4.0 International license. |
Short Introduction
- rivus is a MILP model for multi-commodity energy infrastructure networks systems with a focus on high spatial resolution.
- It finds the minimum cost energy infrastructure networks to satisfy a given energy distribution for possibly multiple commodities (e.g. electricity, heating, cooling, …).
- Time is represented by a (small) set of weighted time steps that represent peak or typical loads
- Spatial data can be provided in form of shapefiles, while technical parameters can be edited in a spreadsheet.
- Sister project to urbs which has a focus on high time resolution analysis.
Demo Output
Besides the numerical results (obtainable programmatically or as an excel report),
rivus is can visualize the results.
You can see a unified figure of the typical result plots bellow created by
rivus.main.rivus.result_figures(), which in turn is a wrapper around
rivus.main.rivus.plot().
Merge was done only for better spacing in the documentation.
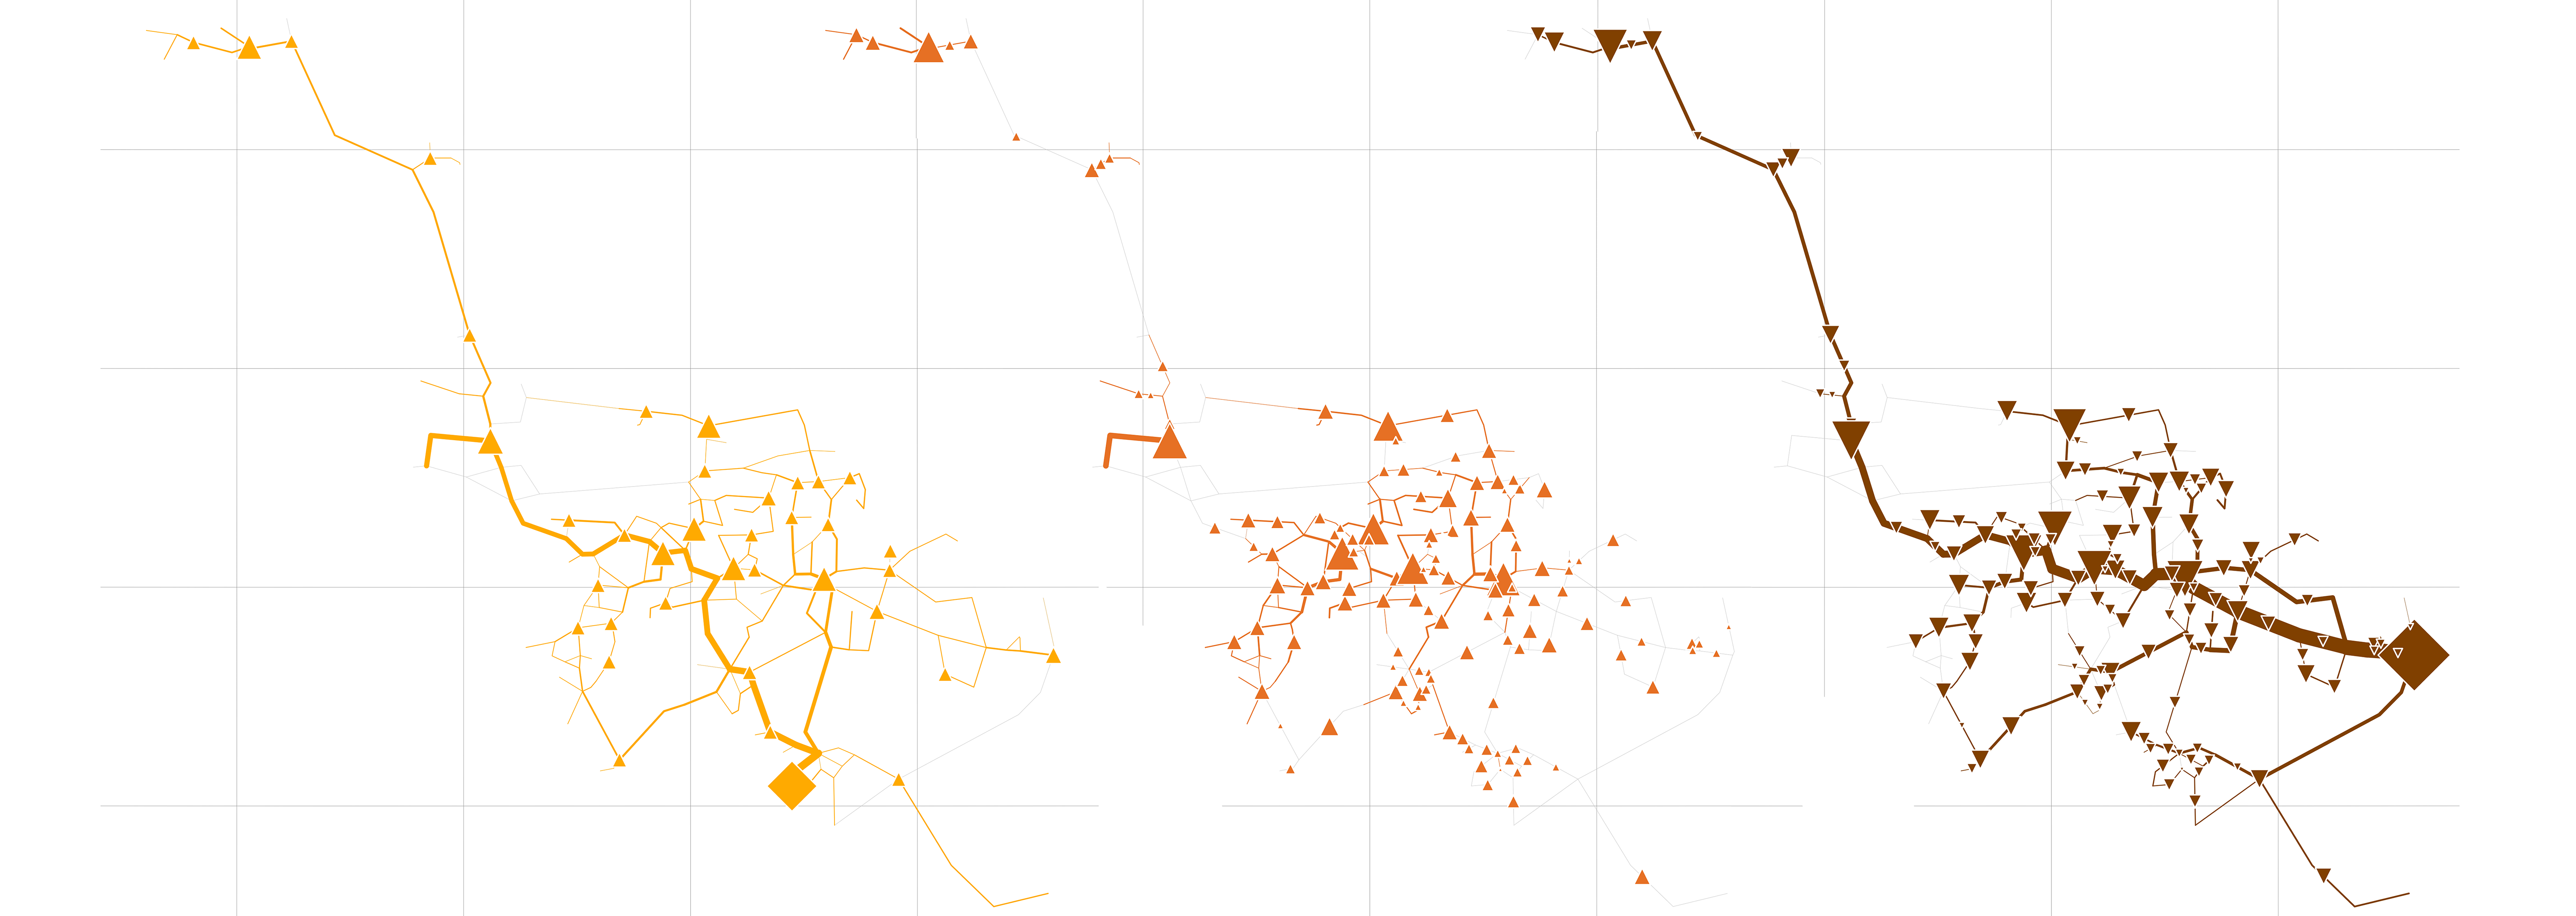
Unified rivus capacity output of a smaller city.
- Yellow:
- Electricity network capacities
- Red:
- Heat network capacities
- Brown:
- Gas network capacities
- Gray:
- Longitude and latitude guidelines.
- Symbols:
- Diamond shapes represent energy sources. The width of the lines represent the amount of built capacity. Triangles represent energy conversion processes. Pointing upwards indicate generation, downwards indicates consumption of that commodity.
If got courious go to Installation
Change-log
Todo
Set version number to 0.2 after accepting the PRs
Version 0.2
- 2017-10
- Major bug-fix regarding line length calculation(#13)
- Major bug-fic regarding usage of hubs in vertices (#37)
- Restructuring (Issue5, PR8)
- 3D visualization for results (PR13)
- Abstract street network generator (PR8, PR28)
- 3D interactive visualization for results (#17)
- Graph/Network analysis sub package (#22)
- PostgreSQL+PostGIS integration (#24)
- Unittests (#33)
- Line length calc bugfix
- Save function extension (#16)
- Excel parsing (#23)
- Speed-ups (#27)
- Fix Warnings (#30)
Version 0.1
- 2015-05
- Initial release.
Dependencies
- Python version 3.x is supported. Version 2.7 may work.
- Pyomo for model equations and as the interface to optimisation solvers
(CPLEX, GLPK, Gurobi, …). Version 4 recommended, as version 3 support
(a.k.a. as coopr.pyomo) will be dropped soon.
- ConcreteModel is the basis to formulate our optimisation problem.
- matplotlib for plotting
- Plotly for interactive 3D plots [extension]
- We use the offline variants of this package.
- Also compatible with the jupyter notebook.
- Pandas for input and result data handling, report generation
- Pandas’ DataFrame is used very extensively throughout rivus.
- SQLAlchemy and psycopg2 for database integration [extension]
- Pandas’s DataFrame works together with SQLAlchemy.
- NetworkX for network analysis [extension]