Introduction
Extension of the welcome page.
- rivus is a MILP model for multi-commodity energy infrastructure networks systems with a focus on high spatial resolution.
- It finds the minimum cost energy infrastructure networks to satisfy a given energy distribution for possibly multiple commodities (e.g. electricity, heating, cooling, …).
- Time is represented by a (small) set of weighted time steps that represent peak or typical loads
- Spatial data can be provided in form of shapefiles, while technical parameters can be edited in a spreadsheet.
- Sister project to urbs which has a focus on high time resolution analysis.
Demo Output
Besides the numerical results (obtainable programmatically or as an excel report),
rivus is can visualize the results.
You can see a unified figure of the typical result plots bellow created by
rivus.main.rivus.result_figures(), which in turn is a wrapper around
rivus.main.rivus.plot().
Merge was done only for better spacing in the documentation.
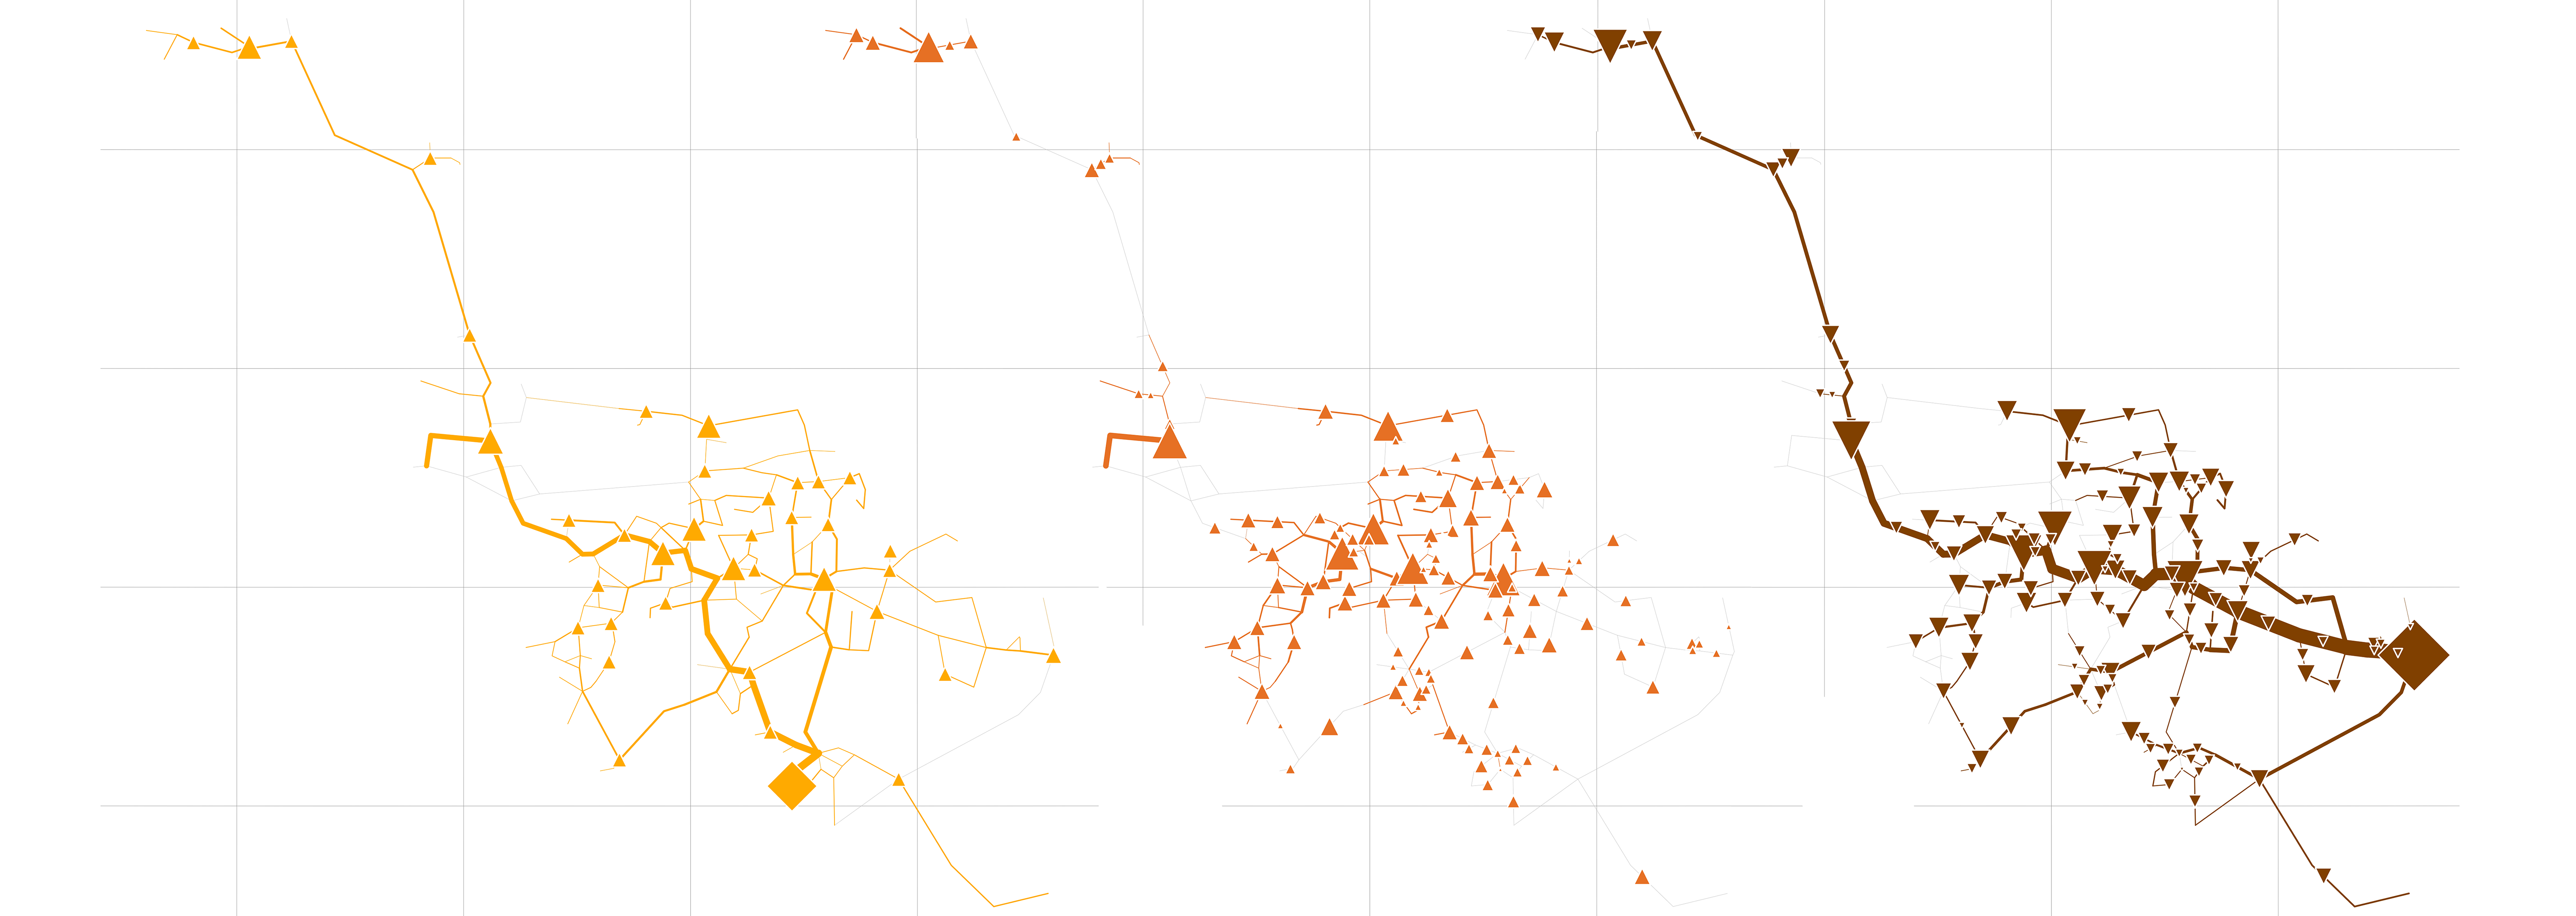
The unified rivus capacity output of a smaller city.
- Yellow:
- Electricity network capacities
- Red:
- Heat network capacities
- Brown:
- Gas network capacities
- Gray:
- Longitude and latitude guidelines.
- Symbols:
- Diamond shapes represent energy sources. The width of the lines represents the amount of built capacity. Triangles represent energy conversion processes. Pointing upwards indicate generation, downwards indicates consumption of that commodity.
Installation
Core Setup
With Miniconda. (A minimal distribution of the Anaconda package manager.) If you already have Anaconda already installed, you are also good to go.
Create a clean environment with the used packages from the SciPy stack:
Get everything up and running with a one-liner (advanced, mainly for doc-build on readthedocs server):
conda env create -f environment.yml
Start with step-by-step installation process:
conda create --name rivus python=3.6 numpy pandas xlrd openpyxl jupyter
Activate your new and shiny environment as written on the console after the installation.
activate rivus # for windows
source activate rivus # linux
Add solver and geoStack.
We use the with - c conda-forge the conda-forge channel, because it makes life easier.
The && and -y chain the commands and suppress installation confirmation, respectively.
(So that you can go grab a coffee during the installation process.):
conda install -y -c conda-forge pyomo glpk &&
conda install -y -c conda-forge pyshp shapely basemap &&
conda install -y -c conda-forge pyproj fiona geopy geopandas
Enhancement Setup
For optional extensions (See next section for more info.)
conda install -y -c conda-forge plotly
conda install -y -c conda-forge networkx
conda install -y -c conda-forge psycopg2 sqlalchemy
Leverage the possibilities of conda environments in your jupyter notebook. (Which is optional but really worth using it):
conda install -y nbconda
If you decide to use rivus.io.db, rivus.utils.notify and do not want to share
your credentials with the world (highlighted), or you simply want to store some run parameters outside
of version controlling. (So “check-box” changes do not disturb the actual code part.)
A config file is useful (and sometimes awaited as config.json in the root of the rivus repository.)
If you use it, please add /config.json to your rivus/.git/info/exclude file.
Download a template for getting you started.
1 2 3 4 5 6 7 8 9 10 11 12 13 14 15 16 17 18 19 20 21 22 23 24 | {
"db" : {
"user" : "postgres",
"pass" : "postgres",
"host" : "localhost",
"base" : "rivus"
},
"email" : {
"s_user" : "your.robot@gmail.com",
"s_pass" : "thereIsASilverBullet!",
"r_user" : "your.address@gmail.com",
"smtp_addr" : "smtp.gmail.com",
"smtp_port" : 587
},
"use_pickle" : true,
"use_report" : true,
"solver" : "glpk",
"use_solver" : true,
"make_plot" : true,
"g_analysis" : true,
"calc_minimal" : true,
"store_db" : true,
"run_comment" : "runchess-test"
}
|
In the e.g. run-script or test you can access these information with only a few lines of code:
import json
config = []
with open('./config.json') as conf:
    config = json.load(conf)
...
password = config['db']['pass']
Should ever occur that NetworkX is too slow for a graph analysis. python-igraph can be a faster alternative.
But mind the possible overhead at installation. (Esp. on Windows)
As for 2017-08 following installation possibilities are available:
conda install -c conda-forge python-igraph  # lin-___-osx | py2.7, py3.4<
conda install -c vtraag python-igraph       # ___-win-___ | py2.7, py3.5
conda install -c marufr python-igraph       # lin-win-osx | py2.7, _____
Go to Tutorial